

What does the US import?


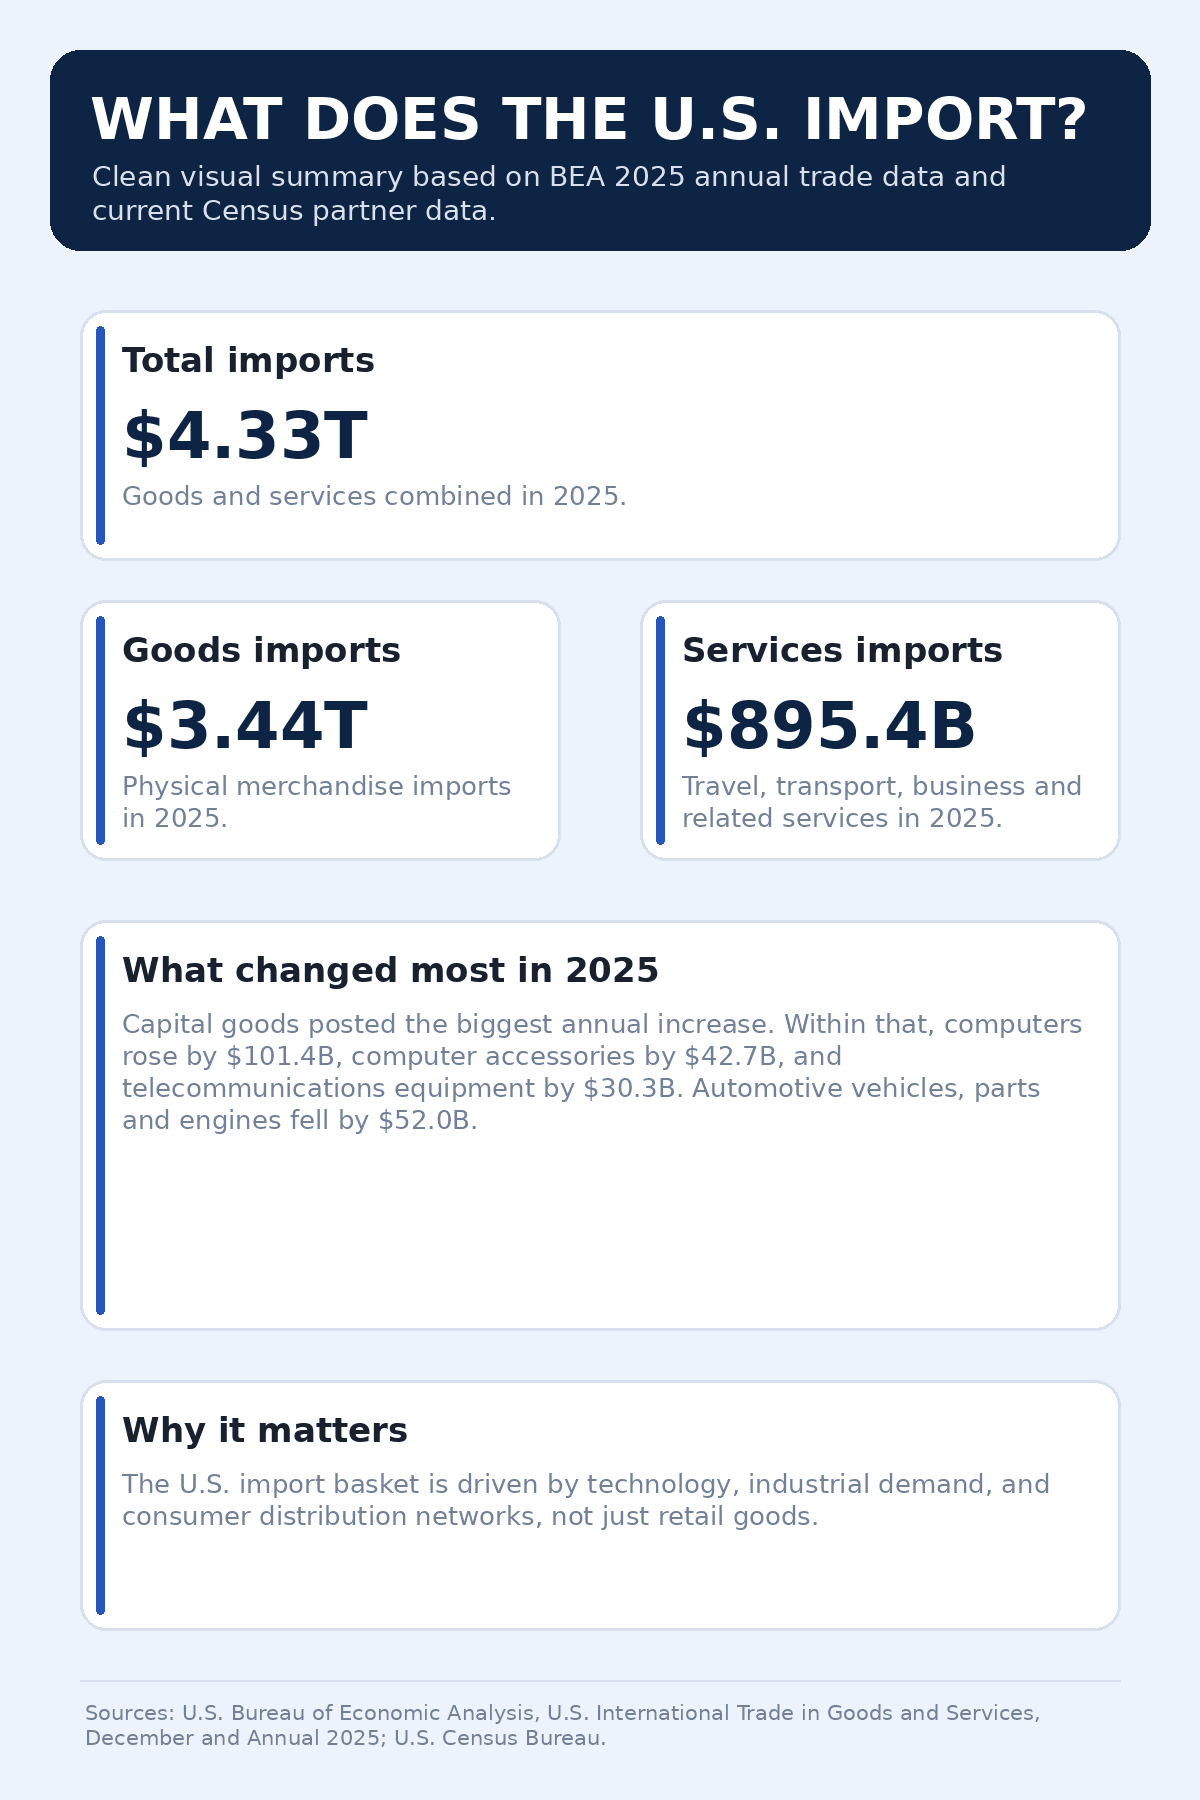
The United States remains one of the world’s largest import markets. In 2025, total U.S. imports reached $4.3338 trillion for goods and services combined. Of that, goods imports totaled $3.4384 trillion and services imports totaled $895.4 billion.
For importers, exporters, and freight planners, that scale matters because the U.S. import basket drives port demand, container flows, inland trucking, warehousing, and customs activity. Businesses comparing routes and shipping setup often start with international freight services before narrowing down cost, transit time, and gateway options.
What Does the US Import Most?
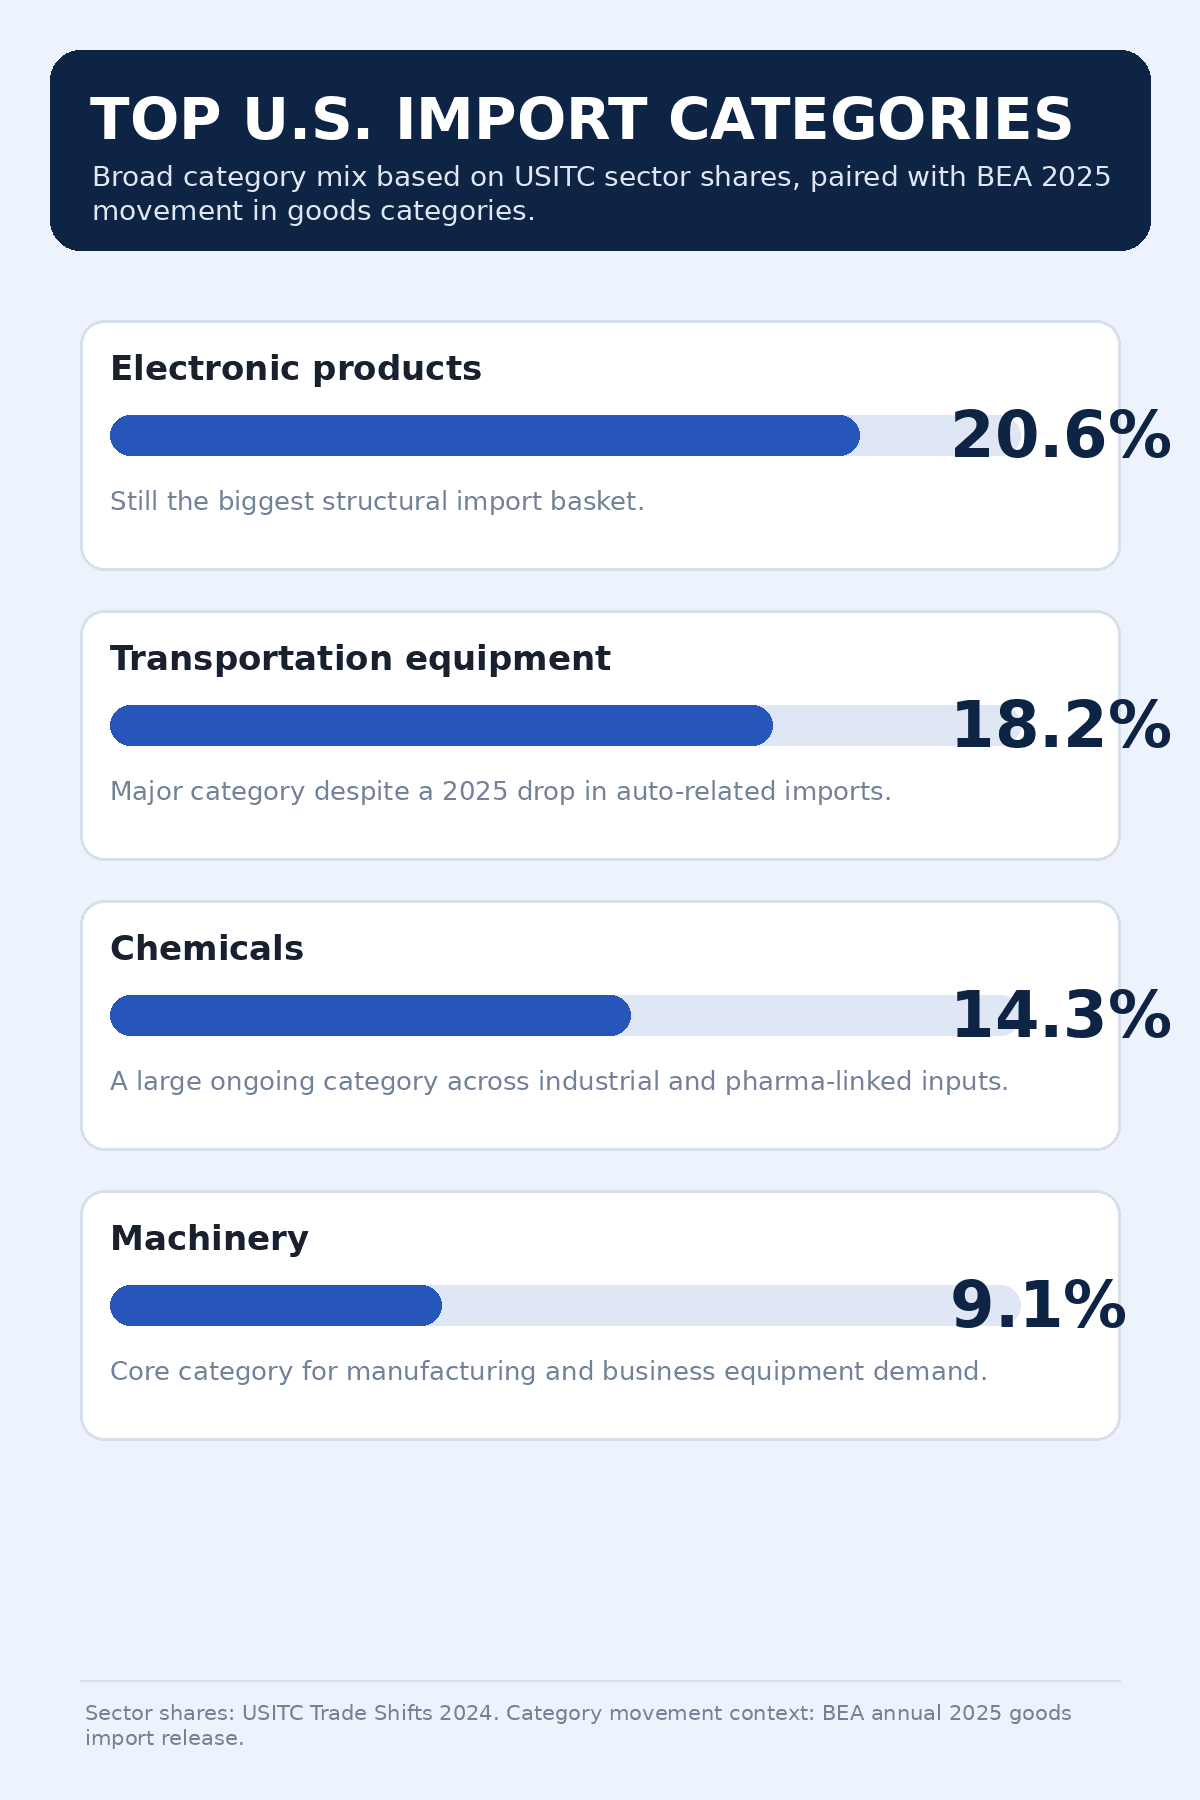
The U.S. import profile is broad, but the biggest baskets are still electronics, transportation equipment, chemicals, and machinery. In USITC’s 2024 sector view, electronic products accounted for 20.6% of imports, transportation equipment 18.2%, chemicals 14.3%, and machinery 9.1%.
That broad pattern also shows up in the 2025 annual goods data from BEA. The biggest increase came from capital goods, which rose by $165.9 billion. Within that category, computers increased by $101.4 billion, computer accessories by $42.7 billion, and telecommunications equipment by $30.3 billion.
This helps explain why the U.S. import mix remains so concentrated in high-value manufactured goods. Consumer demand matters, but industrial demand, technology infrastructure, and business investment are also major drivers of import volume.
Main US Import Categories
The most important U.S. import categories today include:
- electronic products
- transportation equipment
- chemicals and related products
- machinery
- capital goods
- industrial supplies and materials
- consumer goods
- services such as travel and business services
For companies importing containerized freight, categories like electronics, machinery, chemicals, and consumer goods often move through major maritime gateways, which is why route planning often overlaps with shipping documents and port selection.
What Changed in 2025?
The 2025 data shows that U.S. imports did not grow evenly across all categories. Goods imports rose strongly overall, but some groups moved in opposite directions.
The biggest year-over-year increases included:
- capital goods: +$165.9 billion
- industrial supplies and materials: +$23.3 billion
- other goods: +$18.5 billion
At the same time, automotive vehicles, parts, and engines fell by $52.0 billion, including a $34.4 billion decline in passenger cars and a $10.0 billion decline in trucks, buses, and special purpose vehicles.
So while transportation equipment remains one of the biggest structural import categories, the fastest recent import growth came from technology-heavy capital goods rather than autos. That is an inference from the 2024 sector shares and 2025 BEA category changes.
Which Countries Does the US Import From?
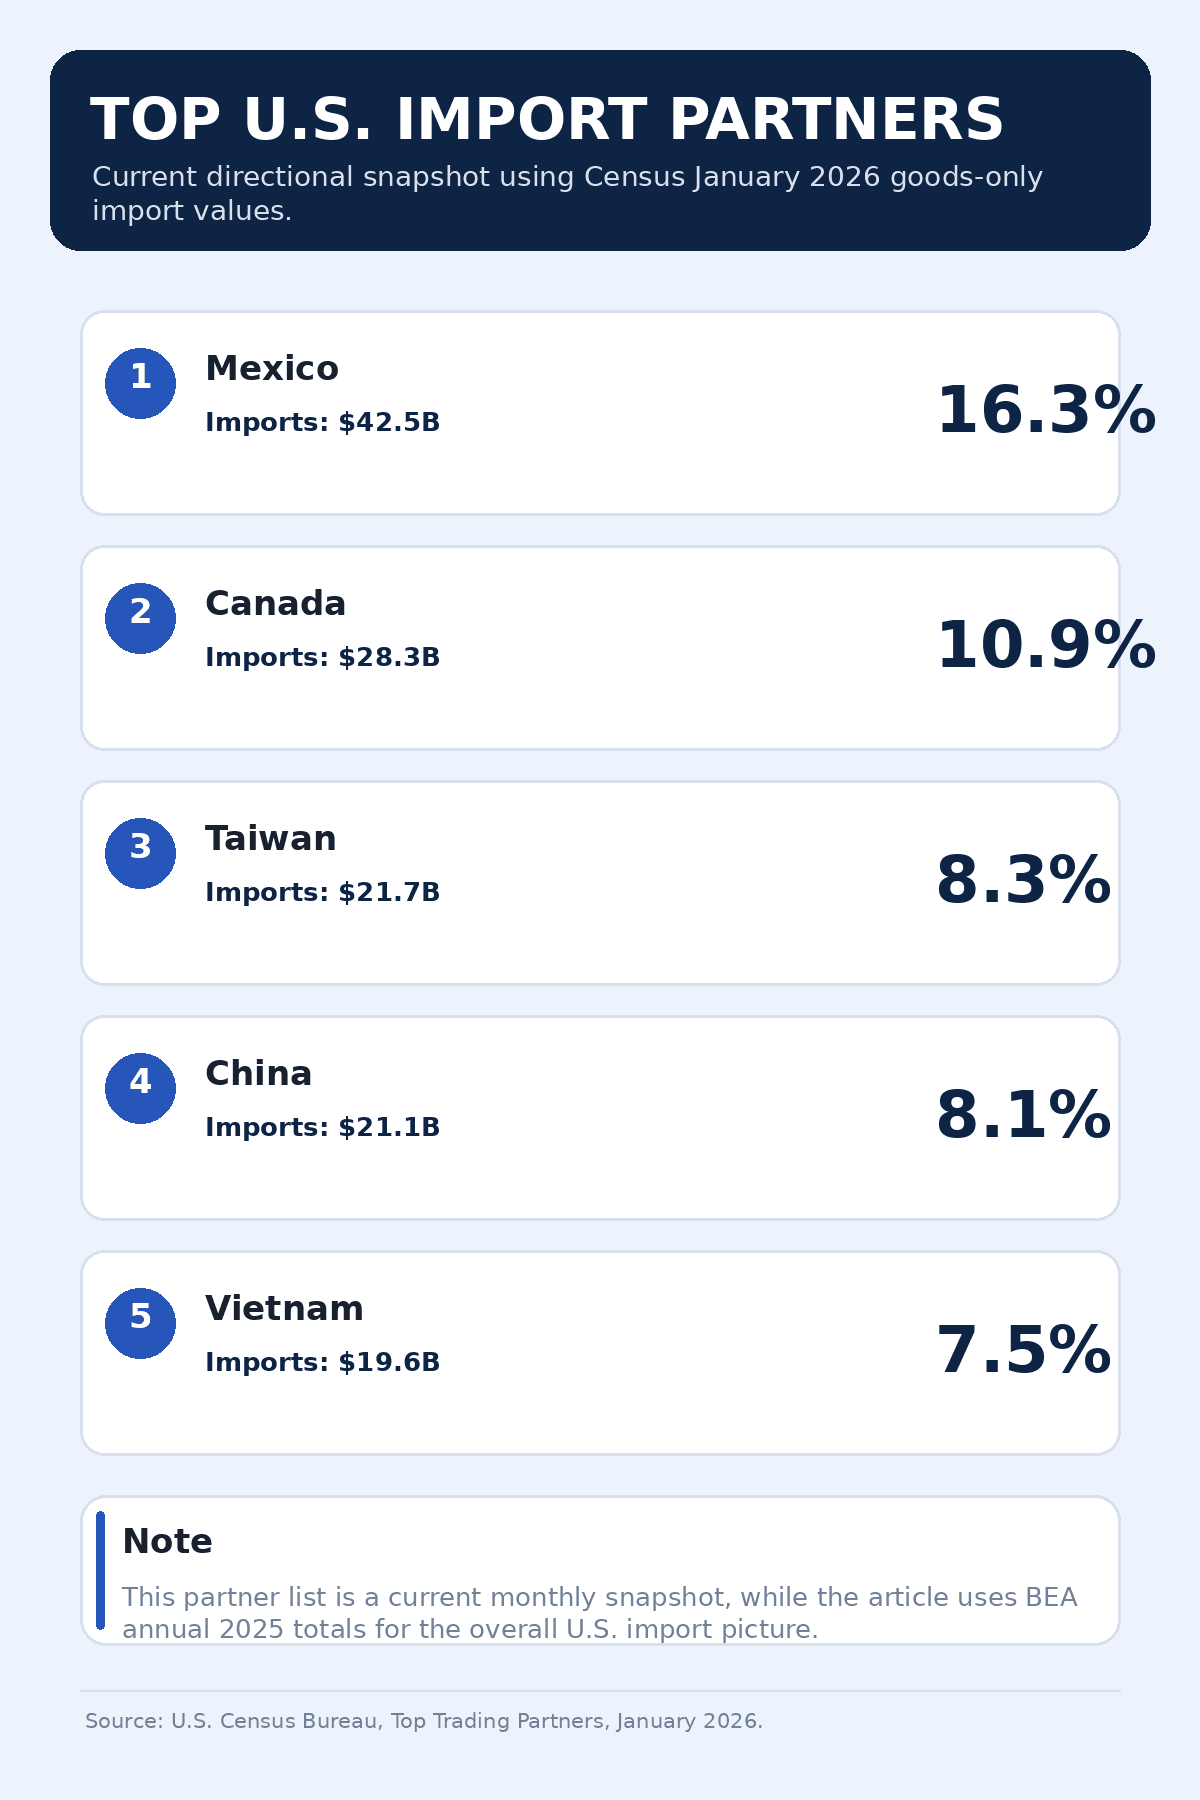
For a current directional snapshot, the Census Bureau’s January 2026 goods-only data shows the top U.S. import partners were:
- Mexico: $42.5 billion
- Canada: $28.3 billion
- Taiwan: $21.7 billion
- China: $21.1 billion
- Vietnam: $19.6 billion
That same Census snapshot shows these five countries accounted for a large share of monthly U.S. goods imports, with Mexico alone representing 16.3% of January 2026 goods imports.
The annual 2025 BEA release also confirms how important Asian manufacturing hubs remain to U.S. import flows. In 2025, U.S. imports from China totaled $308.4 billion, from Vietnam $193.8 billion, and from Taiwan $201.4 billion on the goods side.
Why the US Imports So Much Electronics and Machinery
The U.S. imports large volumes of electronics, machinery, and related capital goods because domestic demand is spread across households, retailers, manufacturers, data infrastructure, healthcare, logistics, and technology firms. The 2025 jump in computers, telecom equipment, and accessories points to continued demand for business hardware, digital infrastructure, and tech equipment.
That matters for logistics because these products are usually time-sensitive, high-value, and heavily containerized. Importers often compare Freight Cost Calculator estimates before booking, especially when cargo value is high enough that mode and timing materially change landed cost.
Infographics to Illustrate the Breakdown of the United States’ Imports
What US Imports Mean for Shippers
The U.S. import basket creates very different freight requirements depending on the cargo.
Electronics and machinery often need reliable container capacity and predictable inland delivery. Chemicals may require stricter documentation and handling rules. Consumer goods tend to be more seasonal. Capital goods can be higher value and more planning-intensive. This is an operational inference based on the composition of current U.S. imports.
When timing is a major factor, importers often use the Transit Time Calculator to compare routes before deciding whether a West Coast, East Coast, or Gulf gateway is the better fit.
Final Thoughts
The U.S. imports far more than retail consumer goods. Its import profile is led by electronics, transportation equipment, chemicals, machinery, and capital goods, and the 2025 data shows especially strong growth in computers, telecom equipment, and related technology imports. Total U.S. imports reached $4.3338 trillion in 2025, confirming the scale and complexity of the American import market.
References
- 1. What Does the US Import Most?
- 2. Main US Import Categories
- 3. What Changed in 2025?
- 4. Which Countries Does the US Import From?
- 5. Why the US Imports So Much Electronics and Machinery
- 6. Infographics to Illustrate the Breakdown of the United States’ Imports
- 7. What US Imports Mean for Shippers
- 8. Final Thoughts
- 9. References
Related Articles


