

What does the US export?


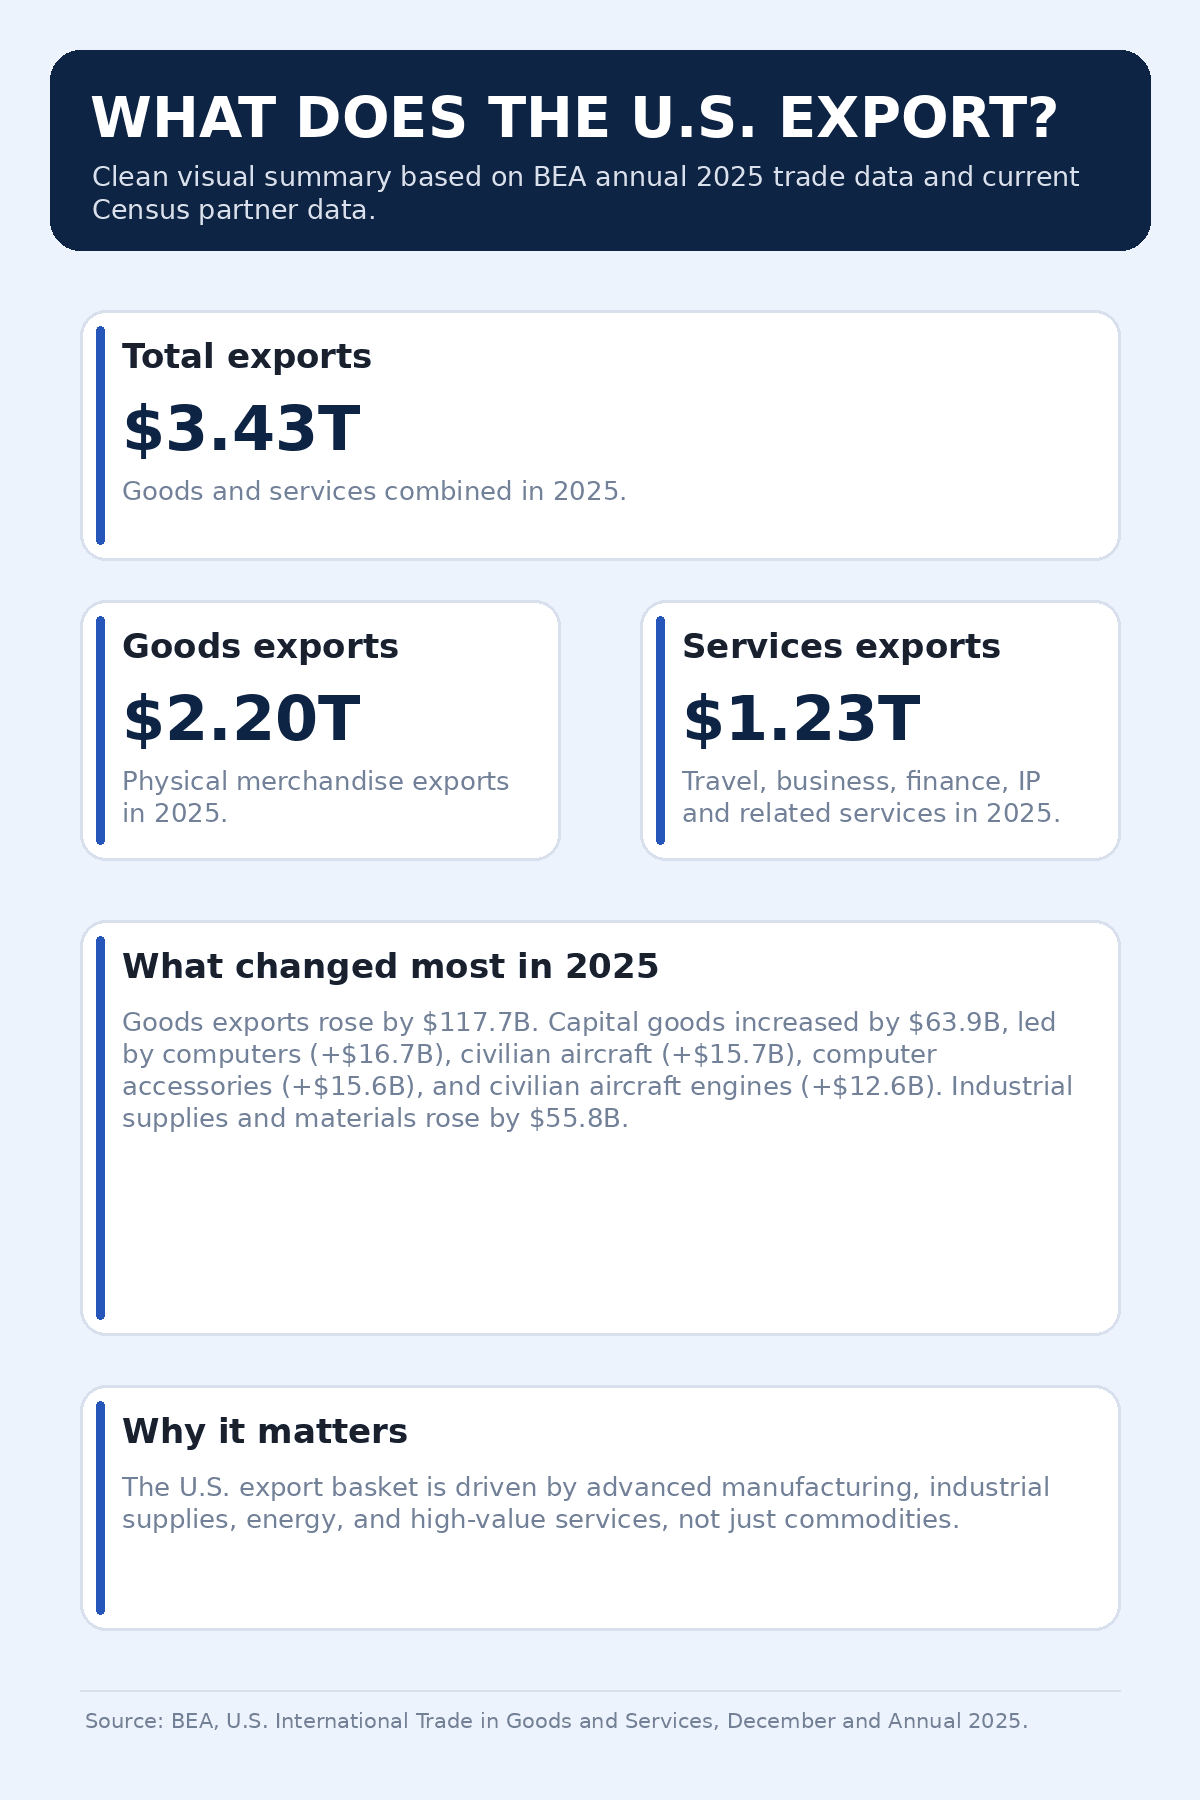
The United States remains one of the world’s largest exporters. In 2025, total U.S. exports reached $3.4323 trillion for goods and services combined. Of that, goods exports totaled $2.1975 trillion and services exports totaled $1.2349 trillion. U.S. exports increased by $199.8 billion, or 6.2%, versus 2024.
For exporters, freight planners, and trade-focused businesses, that scale matters because the U.S. export basket drives port activity, air cargo demand, container flows, specialized industrial logistics, and customs documentation. Companies comparing routes and shipping setup often start with international freight services before narrowing down gateway choice, transit time, and shipment cost.
What Does the US Export Most?
The U.S. export profile is broad, but it is especially strong in capital goods, industrial supplies, advanced manufacturing, energy-linked products, and services. In 2025, goods exports increased by $117.7 billion, while services exports increased by $82.1 billion.
Within goods, the biggest increase came from capital goods, which rose by $63.9 billion. BEA says that gain was led by computers (+$16.7 billion), civilian aircraft (+$15.7 billion), computer accessories (+$15.6 billion), and civilian aircraft engines (+$12.6 billion). Industrial supplies and materials also rose strongly, up $55.8 billion, helped by nonmonetary gold (+$49.7 billion), finished metal shapes (+$19.6 billion), and natural gas (+$19.3 billion).
That helps explain why U.S. exports are not just about raw materials or agriculture. A large share comes from high-value industrial and technology products, plus major service exports.
Main US Export Categories
The most important U.S. export categories today include:
- capital goods
- industrial supplies and materials
- consumer goods
- aircraft and related equipment
- computers and technology-related products
- pharmaceuticals
- services such as business services, travel, finance, and IP-related income
For companies shipping internationally, categories like machinery, aircraft equipment, pharmaceuticals, and industrial materials often require more planning around shipping documents, routing, and destination clearance.
What Changed in 2025?
The 2025 data shows that U.S. exports grew unevenly across categories.
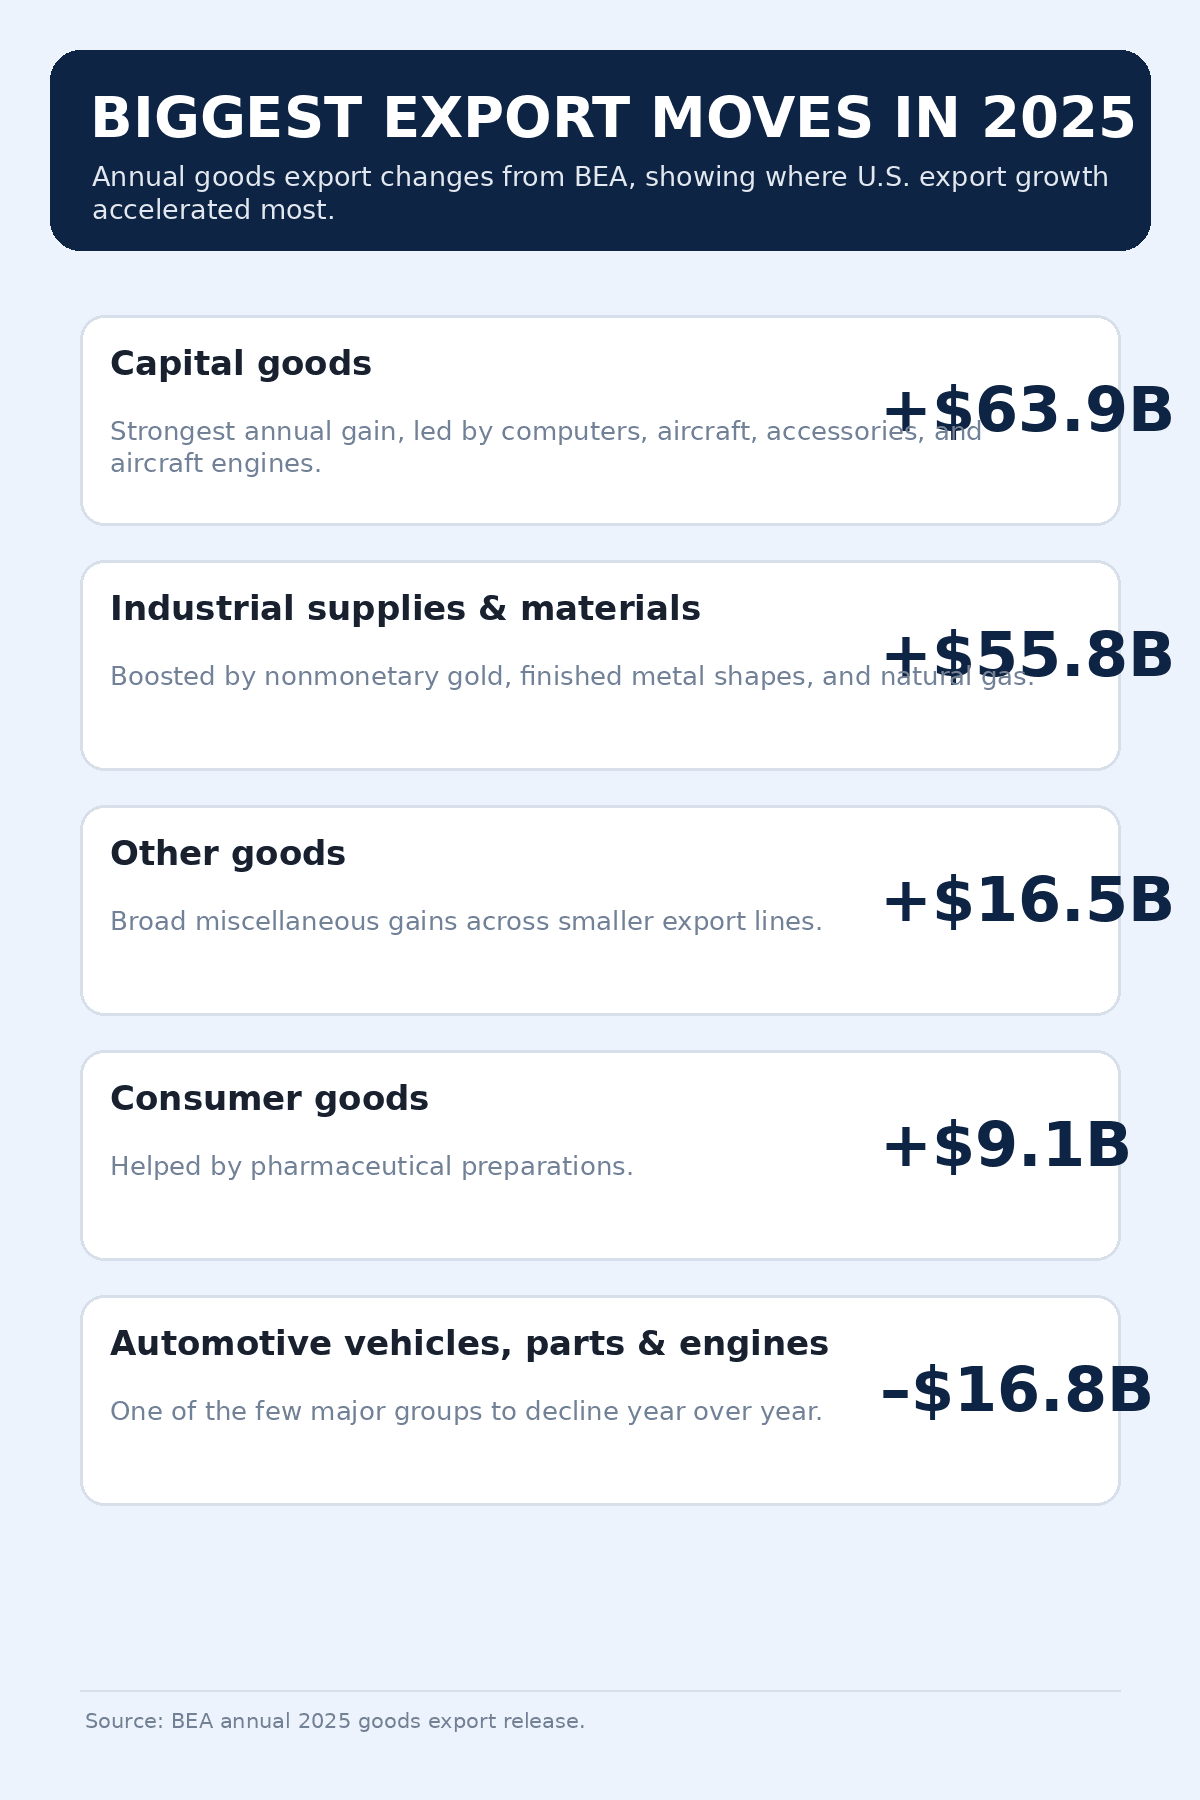
The biggest year-over-year gains included:
- capital goods: +$63.9 billion
- industrial supplies and materials: +$55.8 billion
- other goods: +$16.5 billion
- consumer goods: +$9.1 billion
At the same time, automotive vehicles, parts, and engines fell by $16.8 billion, including a $6.9 billion decline in passenger cars and a $5.8 billion decline in trucks, buses, and special purpose vehicles.
So while autos remain an important U.S. export sector, the strongest recent export growth came from capital goods and industrial supplies rather than vehicles. That is an inference from the BEA annual category changes.
Which Countries Does the US Export To?
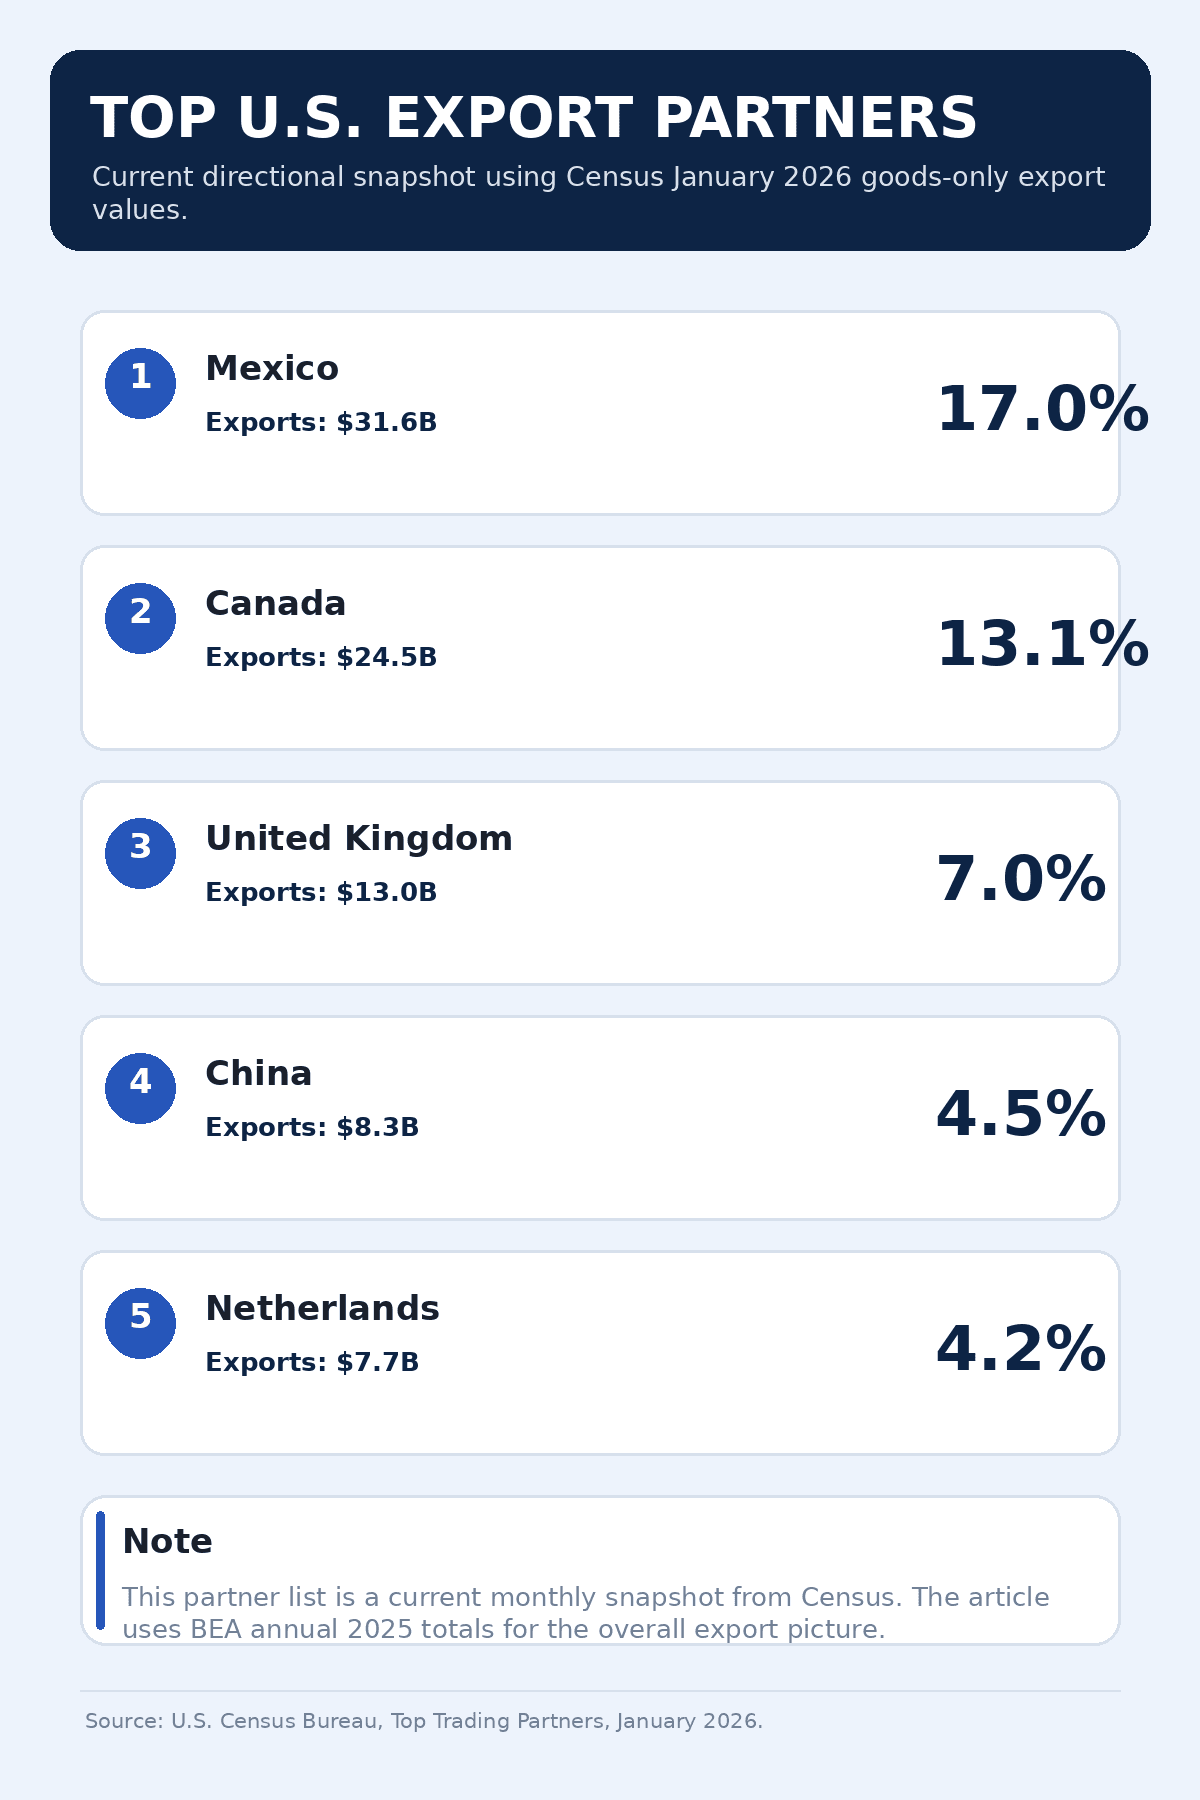
For a current directional snapshot, the Census Bureau’s January 2026 goods-only data shows the top U.S. export partners were:
- Mexico: $31.6 billion
- Canada: $24.5 billion
- United Kingdom: $13.0 billion
- China: $8.3 billion
- Netherlands: $7.7 billion
That same Census release shows Mexico accounted for 17.0% of January 2026 U.S. goods exports, while Canada accounted for 13.1%.
This snapshot reinforces how important North America remains to U.S. exports, while Europe and Asia continue to matter for advanced manufacturing, industrial goods, and specialized services. That final point is an inference from the partner mix and the export-category data.
Why the US Exports So Much Capital Goods and Industrial Supply
The U.S. exports large volumes of capital goods and industrial materials because it remains strong in aerospace, machinery, advanced electronics, energy-linked goods, metals, and high-value industrial production. The 2025 jump in computers, civilian aircraft, aircraft engines, and finished metal shapes shows how export growth is tied to manufacturing depth and industrial demand abroad.
That matters for logistics because these exports are often high-value, technically specified, or time-sensitive. Exporters often compare Freight Cost Calculator estimates before booking, especially when cargo value, size, or urgency materially affects the landed price.
Infographics to Illustrate the Breakdown of the United States’ Exports
What US Exports Mean for Shippers
The U.S. export basket creates very different freight requirements depending on the cargo.
Aircraft and machinery shipments may require specialized handling. Industrial supplies can involve heavy or oversized cargo. Pharmaceuticals may need tighter timing and compliance control. Technology-related exports often move in containerized or air-linked supply chains. This is an operational inference based on the composition of current U.S. exports.
When timing is a major factor, exporters often use the Transit Time Calculator to compare routes before deciding whether an ocean, air, East Coast, West Coast, or inland-linked gateway is the best fit.
Final Thoughts
The U.S. exports far more than commodities alone. Its export profile is led by capital goods, industrial supplies, advanced manufacturing, aircraft, technology products, pharmaceuticals, and major service exports. In 2025, total U.S. exports reached $3.4323 trillion, with especially strong gains in computers, aircraft, aircraft engines, finished metal shapes, and natural gas.
References
- 1. What Does the US Export Most?
- 2. Main US Export Categories
- 3. What Changed in 2025?
- 4. Which Countries Does the US Export To?
- 5. Why the US Exports So Much Capital Goods and Industrial Supply
- 6. Infographics to Illustrate the Breakdown of the United States’ Exports
- 7. What US Exports Mean for Shippers
- 8. Final Thoughts
- 9. References
Related Articles


